

Woodland Carbon Code unit prices

The average reported price of a woodland Pending Issuance Unit is currently estimated to be £28.32, up from £26.85 in 2024.

The range of prices also increased with a spread of £112.50 between the lowest and highest price, compared to £62 last year.

Over 99% of units transacted are Pending Issuance Units. We don’t have enough data to provide the average price of a Woodland Carbon Unit yet.  

This table shows the reported volume and price of Woodland Carbon Code unit sales. 

 2020 20212022  202320242025
Number of Woodland Carbon Code units sold251,594246,148213,936345,725277,815173,722
Volume weighted average price per Pending Issuance Unit - nominal terms£11.01£15.41£19.27£24.24£26.85£28.32
Difference between highest and lowest price (spread price)£130.59£27.76£40.00£37.50£62.00£112.50
  • Volume weighted average is the ratio of the value of credits traded to the total volume traded during a given timeframe ([price x volume summed over all transactions] / total volume).
  • The nominal terms price is the actual cash value reported each year. 
Peatland Code unit prices

The average price of a peatland Pending Issuance Unit is currently estimated to be £39.57, up from £25.04 in 2024. The sample size was small and this average is influenced by three large-scale transactions which were at a significantly higher price than the typical reported transaction price.

The range of prices has increased with a spread of approximately £75 between the lowest and highest price, compared to £7.50 last year.

At least 99% of Peatland Code Units transacted were Pending Issuance Units. We don’t have enough data to provide the average price of a Peatland Carbon Unit yet. 

This table shows the reported volume and price of Peatland Code unit sales. There wasn’t enough data reported in 2020 and 2021 to publish prices for those years. 

 2022202320242025
Number of Peatland Code units sold 11,4169,053187,29128,679
Volume weighted average price per Pending Issuance Unit - nominal terms£23.95£26.00£25.04£39.57
Difference between highest and lowest price (spread price)£25.00£12.25£7.50Approx. £75
  • Volume weighted average is the ratio of the value of credits traded to the total volume traded during a given timeframe ([price x volume summed over all transactions] / total volume).
  • The nominal terms price is the actual cash value reported each year. 

Unit prices by species, project size and location

We don't have enough data to know if there's a real difference in prices by tree species, project size or location.

Woodland prices and volumes over time

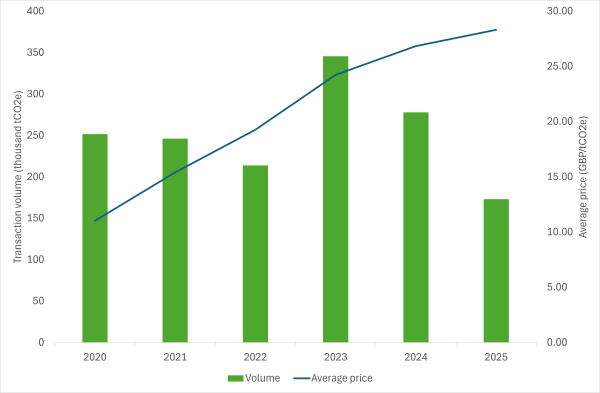
The graph below shows the average reported price and volume of transactions for woodland Pending Issuance Units from 2020 to 2025. 

While the price has increased steadily from £11.01 in 2020 to £28.32 in 2025, the volume of reported transactions is variable, ranging from 173,722 to 346,000 per year.

The volume of reported credit sales is similar to the volume of credits moved to buyers in the UK Land Carbon Registry. Credit movements range from 100,000 to 350,000 per year over the same period.
 

Bar and line chart from 2020 to 2025 showing the increase in carbon price from approx £11 to £28, with variable reported volumes ranging from 174,000 to 350,000

Global carbon prices

Ecosystem Marketplace shares global carbon prices through its State of the Voluntary Carbon Market reports.  

The average price of carbon from Woodland Carbon Code projects is significantly higher than the global average of $6.37 in 2024. This is due to the integrity of our projects and units and the wider social and environmental benefits our projects provide.

Share your carbon prices

Information about the price of carbon units helps to give buyers and sellers an idea of what to expect when they are making transactions in the voluntary carbon market.
 
If you’ve bought or sold UK woodland or peatland carbon units, please report your prices through the Global Carbon Markets Hub

The service is run by Ecosystem Marketplace, an independent organisation which aggregates data to ensure it's anonymous.

To share your data, log into your Global Carbon Markets Hub account or email hub@ecosystemmarketplace.com to get set up. 

How we calculate price information

Our pricing information is calculated by data collected through Ecosystem Marketplace's Global Carbon Markets Hub. 

Project developers and resellers use this platform to disclose information about sales of Woodland Carbon Code and Peatland Code units. Disclosure is voluntary, so the results are not a market-wide estimate of UK voluntary carbon market pricing.  

Ecosystem Marketplace aggregates the sales data to provide average prices and protect the confidentiality of project developers and resellers. 

This table shows how many responses were received each year for woodland projects.

Year202020212022202320242025
Number of respondents355873
Number of projects434132293843

This table shows how many responses were received each year for peatland projects.

Year202020212022202320242025
Number of respondents123333
Number of projects124555

Most users did not specify whether the transactions were for Pending Issuance Units or verified Woodland Carbon or Peatland Carbon Units. 

However, we assume that at least 99% of unit transactions were for Pending Issuance Units. This is because of the very small number of verified Woodland Carbon Units and Peatland Carbon Units that have been issued so far. 

Since 2024, this pricing work has been funded by Scottish Forestry. In 2023 it was completed as part of the Nature Returns Programme led by Natural England in close partnership with the Environment Agency, Forestry Commission and RBG Kew, Wakehurst. The Shared Outcomes Funded Programme is sponsored by Defra and DESNZ. 

Did you find this page helpful?

Rate your experience

Your feedback helps us to improve this website. If you would like a response, please include your email address.

Your feedback helps us to improve this website. If you would like a response, please include your email address.