
45,467 hectares of new woodland created
15.7 million tonnes of planned carbon dioxide removal
907 projects validated to the code

Our impact across the UK
Annual statistics
You can view official annual statistics about the Woodland Carbon Code up to 31 March 2025 in Forest Research’s forestry statistics 2025.
Statistics from earlier years are also available.
Interim statistics
Our interim statistics provide data on Woodland Carbon Code projects up to 31 March 2026.
Number of projects on UK Land Carbon Registry
Projects can be validated, verified or self-assessed individually or as part of a group. This table shows the number of projects validated, verified or self-assessed, whether they were administered individually or as part of a group.
| Number of projects | England | Wales | Scotland | Northern Ireland | UK |
|---|---|---|---|---|---|
Under development | 757 | 187 | 401 | 95 | 1,440 |
| Validated only | 179 | 55 | 424 | 16 | 674 |
| Verified at year 5 | 65 | 18 | 144 | 4 | 231 |
| Self-assessed at year 15 | 0 | 0 | 2 | 0 | 2 |
| Total validated | 244 | 73 | 570 | 20 | 907 |
| All projects | 1,001 | 260 | 971 | 115 | 2,347 |
Area of projects on UK Land Carbon Registry
| Area (hectares) | England | Wales | Scotland | Northern Ireland | UK |
|---|---|---|---|---|---|
Under development | 10,204 | 1,813 | 50,995 | 788 | 63,799 |
| Validated only | 3,780 | 1,420 | 30,336 | 261 | 35,796 |
| Verified at year 5 | 1,110 | 429 | 8038 | 68 | 9,644 |
| Self-assessed at year 15 | 0 | 0 | 26 | 0 | 26 |
| Total validated | 4,889 | 1,849 | 38,400 | 329 | 45,467 |
| All projects | 15,094 | 3,661 | 89,394 | 1,117 | 109,266 |
Projected carbon sequestration of projects
| Projected sequestration (million tCO2e) | England | Wales | Scotland | Northern Ireland | UK |
|---|---|---|---|---|---|
Under development | 4.1 | 0.7 | 11.4 | 0.4 | 16.5 |
| Validated only | 1.5 | 0.5 | 10.1 | 0.1 | 12.2 |
| Verified at year 5 | 0.6 | 0.1 | 2.7 | 0.02 | 3.4 |
| Self-assessed at year 15 | 0 | 0 | 0.01 | 0 | 0.001 |
| Total validated | 2.1 | 0.7 | 12.8 | 0.1 | 15.7 |
| All projects | 6.2 | 1.3 | 24.2 | 0.5 | 32.2 |
These figures include both the carbon units which can be sold and those which are allocated to the buffer.
Size of validated and verified projects, number of projects by country
Species of validated and verified projects, by area and country
Management of validated and verified projects, by area and country
Map of projects, by status
Number of Woodland Carbon Units available on UK Land Carbon Registry
| Type of unit | Available from project developer | Available from retail aggregator or trader | Already sold | Retired Woodland Carbon Units | Buffer units | Total |
|---|---|---|---|---|---|---|
Pending Issuance Units | 7,551,000 | 234,000 | 3,551,000 | 0 | 2,835,000 | 14,171,000 |
| Woodland Carbon Units | 1,300 | 100 | 4,300 | 4,600 | 2,400 | 12,700 |
One carbon unit equals one tonne of carbon dioxide equivalent
Available for sale - units for sale by a project developer or retail aggregator
Already sold - units which have been transferred from a project developer to a corporate buyer’s account or have been assigned to a corporate buyer (if Pending Issuance Units)
Landowners growing their own units - units owned by organisations planning to use them against emissions within their own company/organisational boundaries (insetting)
Retired Woodland Carbon Units - verified credits which are 'retired' or taken out of use by the final user
Buffer units - units which are put aside and stored in a shared buffer pool in case of any future loss of Woodland Carbon Units
Pending Issuance Units - validated units of carbon dioxide equivalent which are projected to be delivered/sequestered in future.
Woodland Carbon Units - verified units of actual sequestered carbon dioxide equivalent.
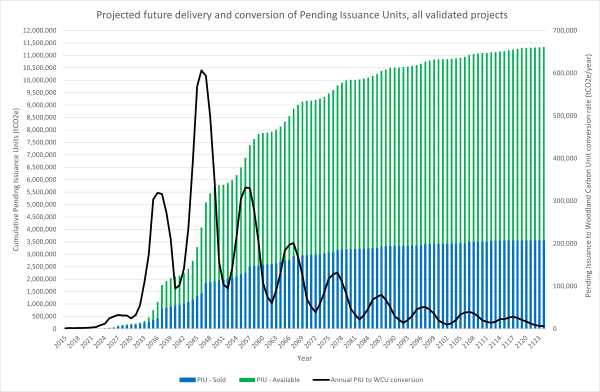
Conversion of units
Woodlands validated to the Woodland Carbon Code will sequester carbon dioxide over the next 100 years.
The chart below shows the projected annual conversion rate of Pending Issuance Units to Woodland Carbon Units over that period (black line) and the cumulative sequestration of validated projects over that time (bars).
As more projects are validated, more units will be available and the conversion rate will increase. Verified Woodland Carbon Units and buffer units are not included on the chart.
Spatial dataset
You can view and download our spatial dataset from the platforms below. The dataset is updated every three to six months and includes projects which are at the validation stage or beyond.
Open data sites are best for downloading the dataset, while map viewers only allow you to view the data.
The metadata is available on SpatialData.gov.scot