UK carbon prices
- Woodland Carbon Code unit prices
- Peatland Code unit prices
- UK carbon price and volume
- How we calculate price information
- Reporting your carbon prices
- Global carbon prices
Woodland Carbon Code unit prices
The average price of a Pending Issuance Unit is currently estimated to be £26.85.
We don’t have enough data to provide the average price of a Woodland Carbon Unit yet.
This table shows the number and price of Woodland Carbon Code units. In 2023 and 2024, over 99% of units transacted were Pending Issuance Units. All transactions reported to Ecosystem Marketplace that could be attributed to a specific project were Pending Issuance Units.
2020 | 2021 | 2022 | 2023 | 2024 | |
Number of Woodland Carbon Code units sold | 251,594 | 246,148 | 213,936 | 345,725 | 277,815 |
Volume weighted average price per Pending Issuance Unit - nominal terms | £11.02 | £15.41 | £19.27 | £24.24 | £26.85 |
Difference between highest and lowest price (spread price) | £130.59 | £27.76 | £40.00 | £37.50 | £62.00 |
- Volume weighted average is the ratio of the value of credits traded to the total volume traded during a given timeframe ([price x volume summed over all transactions] / total volume).
- The nominal terms price is the actual cash value reported each year.
Woodland Carbon Code unit prices by main species
Broadleaved projects attracted a higher price than mixed conifer/broadleaved or conifer projects.
We don’t have enough data to report on all categories for all years yet.
This table shows the number and price of Woodland Carbon Code units by species. Over 99% of units transacted were Pending Issuance Units.
2020 | 2021 | 2022 | 2023 | 2024 | |
Broadleaved (more than 80%) - volume | -- | 57,834 | 27,864 | 128,622 | 179,570 |
Broadleaved (more than 80%) - price | -- | £16.71 | £22.83 | £26.33 | £27.84 |
Mixed mainly broadleaved (50% to 80%) - volume | -- | -- | -- | -- | -- |
Mixed mainly broadleaved (50% to 80%) - price | -- | -- | -- | -- | -- |
Mixed mainly conifer (50% to 80%) - volume | -- | -- | 102,598 | 41,896 | -- |
Mixed mainly conifer (50% to 80%) - price | -- | -- | £19.00 | £21.21 | -- |
Conifer (more than 80%) - volume | -- | -- | 66,016 | -- | 70,888 |
Conifer (more than 80%) - price | -- | -- | £16.79 | -- | £25.04 |
- Volume weighted average is the ratio of the value of credits traded to the total volume traded during a given timeframe ([price x volume summed over all transactions] / total volume).
- The nominal terms price is the actual cash value reported each year.
Peatland Code unit prices
This table shows the number and price of Peatland Code units. 100% of Peatland Units transacted were Pending Issuance Units. There has been insufficient data reported in 2020 and 2021 to date so prices for those years cannot be published.
2022 | 2023 | 2024 | |
Number of Peatland Code units sold | 11,416 | 9,053 | 187,291 |
Volume weighted average price per Pending Issuance Unit - nominal terms | £23.95 | £26.00 | £25.04 |
Difference between highest and lowest price (spread price) | £25.00 | £12.25 | £7.50 |
UK carbon price and volume
The graph below shows the average price and volume of transactions for Woodland Carbon Code Pending Issuance Units from 2020 to 2024. Over this five-year period, the average price of units has increased from £11.02 to £26.85.
How we calculate price information
Our pricing information is calculated by data collected through Ecosystem Marketplace's Global Carbon Markets Hub. Project developers and resellers use this platform to disclose information about sales of Woodland Carbon Code and Peatland Code units. Ecosystem Marketplace aggregates the sales data to provide average prices and protect the confidentiality of project developers and resellers.
Data collected in 2023: In 2023, 684 transactions were recorded. There were 575 Woodland Carbon Code transactions and 109 Peatland Code transactions. In total, over 525,000 carbon units were sold in these transactions.
Data collected in 2024: In 2024, an additional 93 transactions were reported for Woodland Carbon Code credits, bringing the total to 668 transactions and the total reported volume to over 865,000 credits. As of publication, there was only one respondent who reported sales in 2024 so, to maintain confidentiality, we cannot report on disaggregated 2024 transactions yet. Ecosystem Marketplace also collected additional data on Peatland Code credit transactions, bringing the total reported volume to over 29,000 carbon credits and 122 transactions. However, there are still less than two respondents for years other than 2022, so we cannot report disaggregated Peatland Code sales for other years yet.
2025 data collection for 2020 to 2024: An additional seven data submissions were received for the calendar year 2024, including seven respondents who reported Woodland Carbon Code transactions representing 38 projects and three respondents who reported Peatland Code transactions representing five projects.
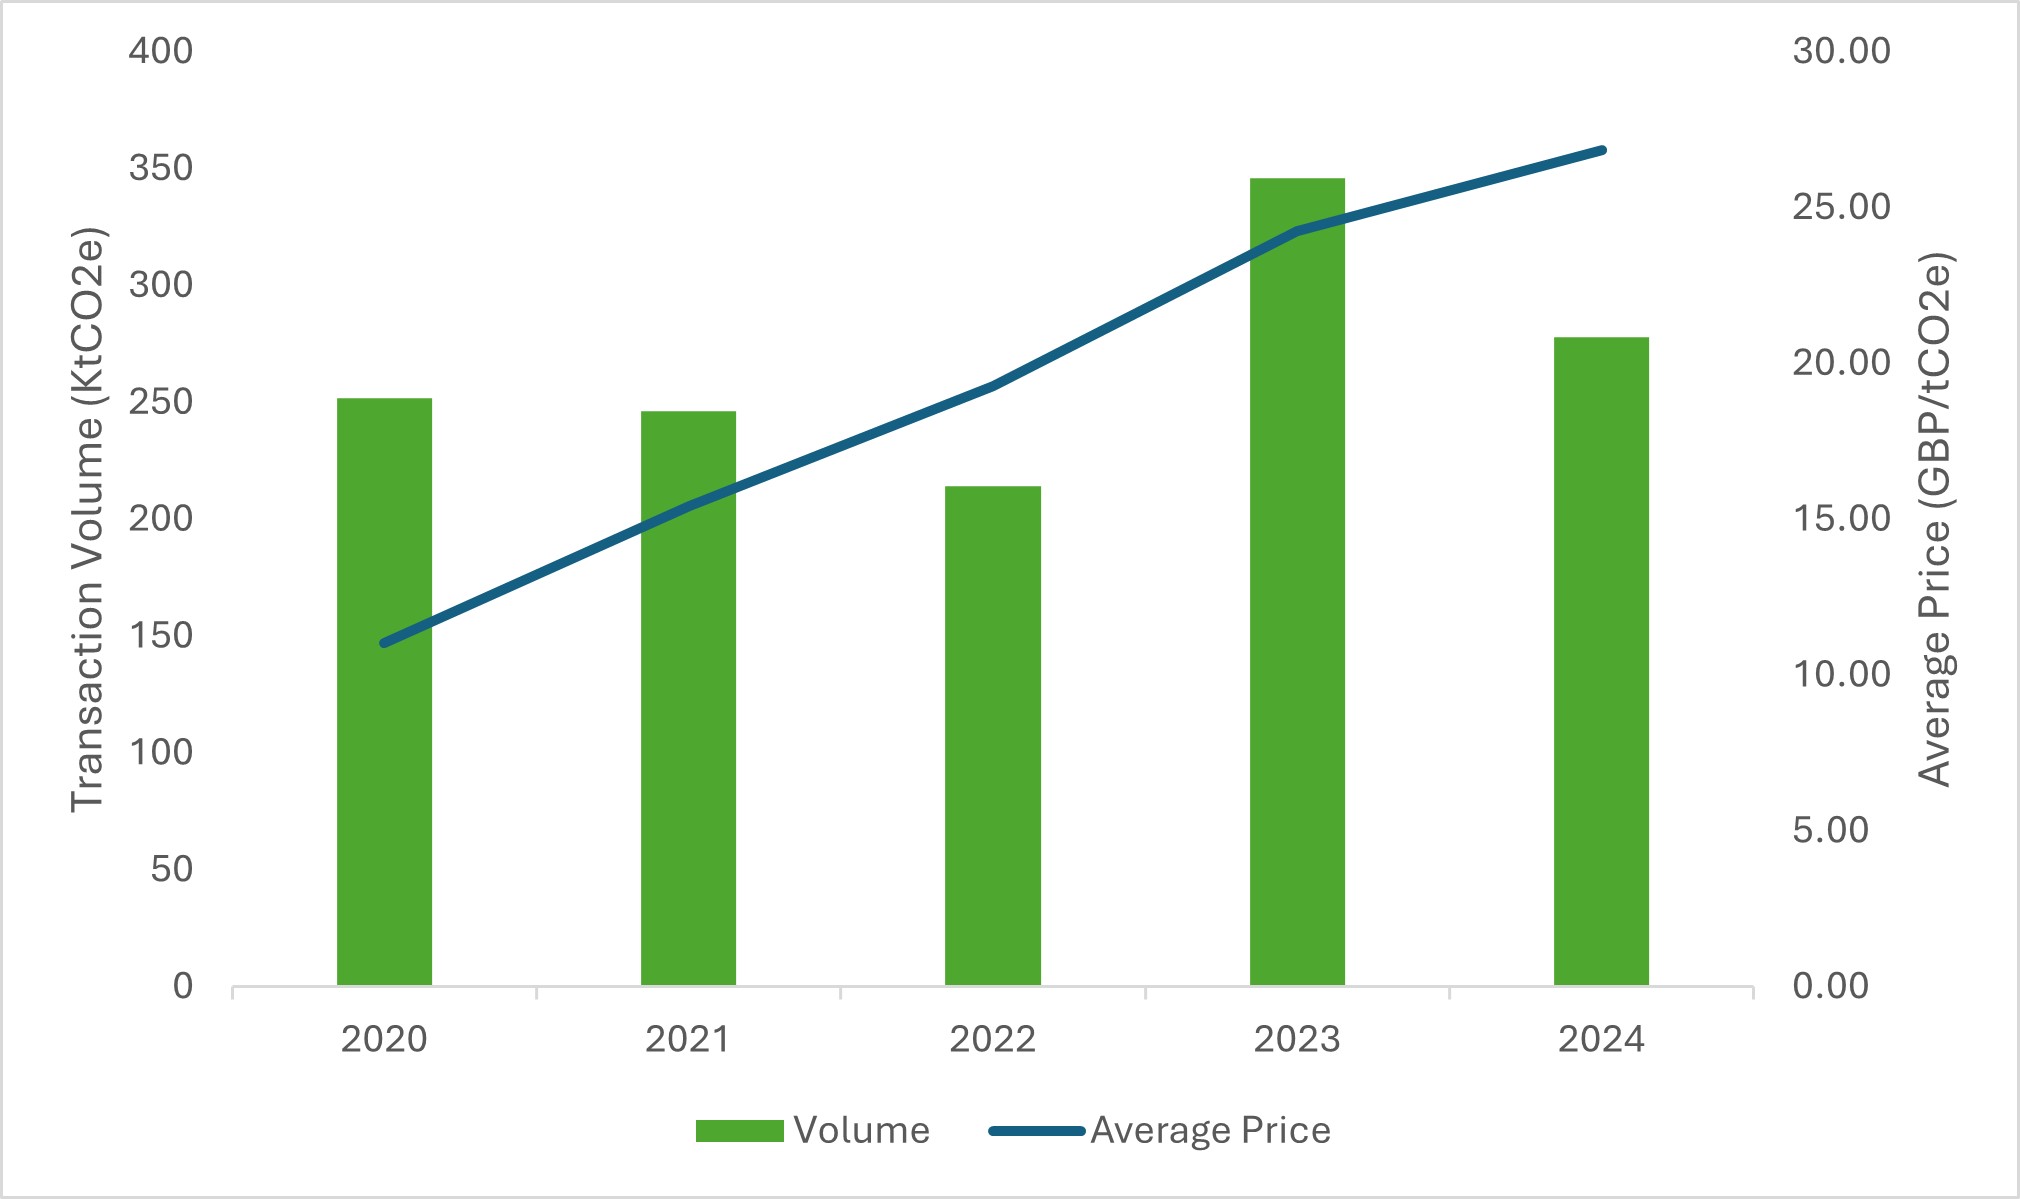
As of 2 April 2025, the total 2024 volume of Woodland Carbon Code credit transactions reported to Ecosystem Marketplace was 277,815 tonnes and the total 2024 volume of Peatland Code credit transactions reported was 187,291 tonnes. The total volume of Woodland Carbon Code credit transactions reported to EM through to 2 April 2025 totalled 1,336,685 tonnes, which includes transactions dating from 2020 through 2024. The volume of Peatland Code credit transactions reported to Ecosystem Marketplace through 2 April 2025 totalled 216,679 tonnes, which includes transactions dating from 2020 through 2024.
In 2023 most users did not specify whether the transactions were for Pending Issuance Units or verified Woodland Carbon or Peatland Carbon Units. However, we assume that 100% of peatland unit transactions and 99% of woodland unit transactions were for Pending Issuance Units. This is because no peatland units have been converted to verified units yet and a maximum of 3,000 woodland credits have been sold as verified units.
In 2024, all transactions reported were for Pending Issuance Units.
All Woodland Carbon Code and Peatland Code transactions reported to Ecosystem Marketplace that could be attributed to a specific project represented assignments of Pending Issuance Units, based on the list of projects issuing Woodland Carbon Units as of 2 April 2025.
In 2024 and 2025, this pricing work was funded by Scottish Forestry. In 2023 it was completed as part of the Nature Returns Programme led by Natural England in close partnership with the Environment Agency, Forestry Commission and RBG Kew, Wakehurst. The Shared Outcomes Funded Programme is sponsored by Defra and DESNZ.
Reporting your carbon prices
We are working with project developers, resellers and buyers to increase the frequency and volume of sales which are reported through the Global Carbon Markets Hub. This will help us to provide more information about the price different units are sold for. For example, in 2024 we were able to report the species split for woodland projects for the first time.
If you are a project developer, reseller or buyer, please help us by reporting sales through Ecosystem Marketplace's Global Carbon Markets Hub. Contact This email address is being protected from spambots. You need JavaScript enabled to view it. to find out more.
Global carbon prices
Ecosystem Marketplace shares global carbon prices through its State of the Voluntary Carbon Market reports.
The average price of carbon from Woodland Carbon Code projects is significantly higher than the global average of £5.12. This is due to the integrity of our projects and units and the wider social and environmental benefits our projects provide.